Bonus ticks for those who learn how to spell statistics by Friday!
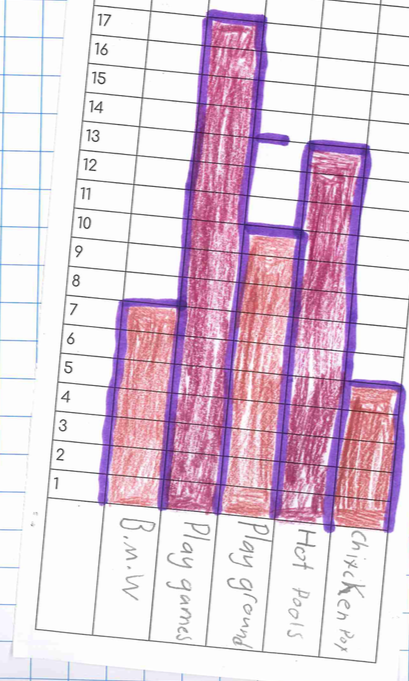
We made a tally chart with Mrs. Vukona yesterday of our holiday activities! We all had a go making our own tally chart interviewing people around the room and today we made some graphs.
Tomorrow we will come up with some statements of what we notice in our graphs.
More than... less than... the most... the least... the same...
This is take one of graph making 2018!
We found getting the lines in the right place a bit challenging at times but not a bad effort really.


Izzie, Evelyn and Tyrese made their graphs from the data they collected.


Comments
Post a Comment